

Image in header: Model of the energy given off by our sun since its creation (note it is a logarithmic time scale). Source: https://www.researchgate.net/figure/Evolution-of-the-solar-luminosity-as-computed-from-a-stellar-evolution-model-Baraffe-et_fig1_356513556
The graph in the header shows that solar energy on Earth increases with time. This is peculiar to the kind of star the Sun is. On the top horizontal axis you can see the time relative to today in billions of years ago. So since the emergence of life on Earth (possibly about 4 billion years ago, but we don’t know that very well), solar energy has continuously increased very slowly. 4.5 billion years ago, we got about 70% of today’s energy on our planet. Should the atmosphere then have been the same as today, it would therefore be far too cold. Then the Earth would be a big frozen sphere, and liquid water would not be possible. That’s clearly not how it happened. More to the point, the Earth actually managed to gradually retain less heat as more solar energy came in. The graph below shows this from 4.5 GA to today.
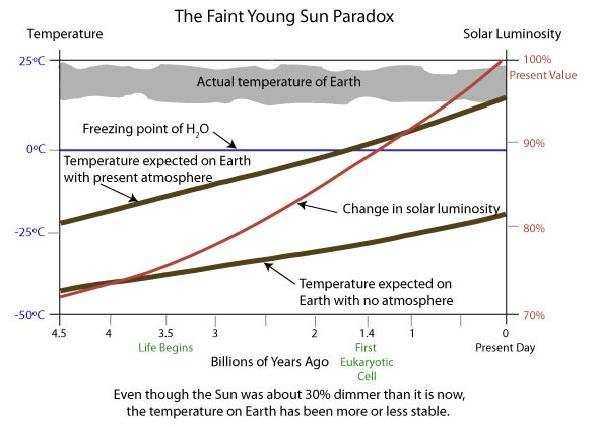
On the graph above, we see the slow increase in solar energy over 4.5 billion years, indicated by a red line. The two thick black lines show the calculated temperature the Earth would have (average annual temperature) if there were no atmosphere (as on the Moon) and if the atmosphere had been the same as today all this time. In the latter case, the average temperature would have remained below the freezing point of water for the first 2.8 billion years! However, examination of rocks (and isotopes) shows that the average annual temperature has remained nicely within livable limits all this time. This is shown on the graph with the top grey band. This representation is schematic and shows a stable trend. However, there were also outliers not drawn here, such as the Sturtian ice ages and the Marinoan ice ages in the period 720-635 Ma. In the most extreme ‘snowball Earth’ moments during those times, the global average temperature did go below freezing. Possibly as low as -20°C to -40°C. The then (mainly single-celled) life on Earth then narrowly escaped complete extinction. At the equator and around local active volcanoes, temperatures must have been above freezing anyway, so there were survival zones where photosynthesis also remained possible. These snowball Earth periods are of course rare throughout geological history. In any case, we can conclude that the atmospheric composition was modified enough throughout history to allow terrestrial life to persist relentlessly. Yet at least since the end of the hadeiocene (from 3.9 GA onwards). This is not so obvious. A planet derailing into an unlivable situation via positive feedback mechanisms is easy to imagine. Venus and Mars are actually in that case. It is really amazing that every time, Earth retained just enough greenhouse gases so that it did not remain unlivably hot or unlivably cold.
How was the Earth always able to adapt sufficiently? Let us look again at the schematic representation of the composition of the atmosphere throughout the planet’s history:
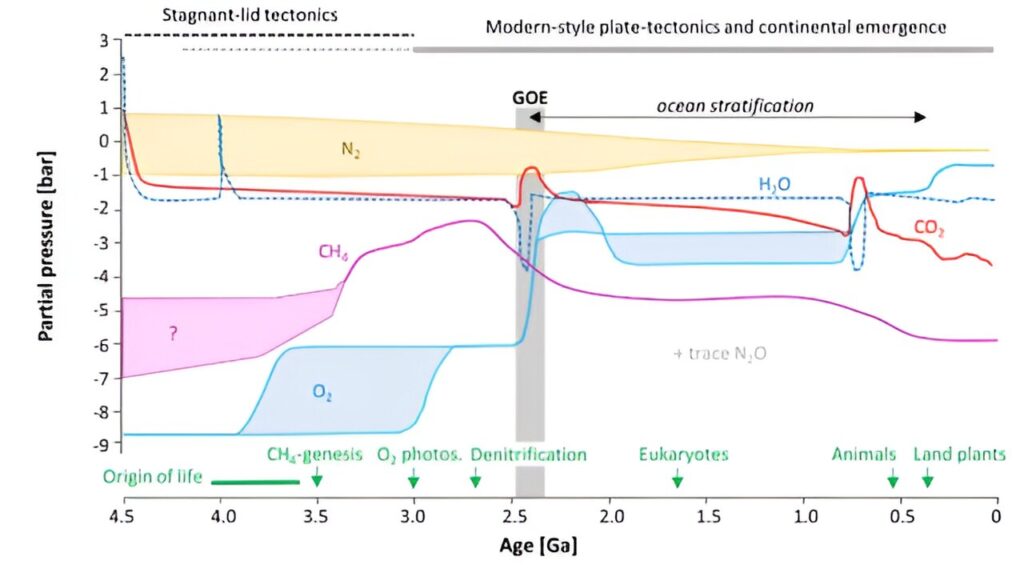
Let’s go over the trend on the graph for each of the most relevant atmospheric gases:
N2 – nitrogen gas
The current partial pressure of nitrogen gas is 78% (on the log y-axis here, this is a rounded value of -0.1). When the Earth formed, a fairly large amount of ammonium (NH3) was emitted via volcanism. These molecules were split by UV radiation, and most ended up as nitrogen gas (N2) and hydrogen gas (H2). The very light hydrogen gas could escape much more easily from Earth’s gravity into empty space. We suspect that the amount of nitrogen remaining then was little different from today’s amount. This is because nitrogen gas is very passive. It doesn’t actually react with anything. So it simply remained in our air. At some point, plants did start taking nitrogen from the atmosphere with the help of fungi (which they still do plenty of today). The uptake by plants was certainly relevant for soil fertility and thus the development of land ecosystems (nitrates – NO3 – are important nutrients). But the amount was low enough not to significantly change the composition of the atmosphere.
CO2 – Carbon dioxide
The solid red line shows the trend of carbon dioxide. Due to volcanic outgassing, our planet started with a very high concentration ofCO2. Although concentrations fell very quickly due to carbonate formation and plate tectonics, for the first 4 billion years the amount ofCO2 remained well above the 420 ppm (0.004%) we have today (and 280 ppm before the industrial revolution). If you look at the red line, you see a slight downward trend across the board. This is partly due to the cooling of the planet, and thus the reduction of volcanism. This gradual reduction of an important greenhouse gas does seem ideal to offset the effect of the gradual increase in solar energy. This is already an important explanation for the stabilisation of the global climate to keep the planet within livable limits. Furthermore, we see that the CO2 level on the trend line goes up sharply twice after a significant drop. These are the major global ice ages during the Great Oxydation Event (GOE, 2.4-2.0 GA) and during the Cryogenian (720-635 MA). The initial decline helps explain the ice ages (less greenhouse gas), but how do you explain the subsequent rise? Because almost the entire Earth was then covered in ice,CO2 could not rain out and get back into the mantle via silicate weathering (remember the Earth’s thermostat of 1.7). Meanwhile, volcanoes did continue to add CO2, and photosynthetic organisms could no longer use globalCO2 for growth – they could only do so in ice-free zones. It is because of this relatively rapid rise inCO2 that the Earth was able to escape from its snowball state time and again.
H2O– water vapour
LikeCO2, water is a main component of the great outgassing from volcanism during the formation of our planet (Hadean). Consequently, the atmosphere started with abundant water vapour, a powerful greenhouse gas. But soon after the first million years, global cooling caused it to rain out, and for the formation of the oceans. Those oceans have always had a buffering effect on climate, as discussed earlier. The dark blue dotted line on the graph further shows a fairly stable concentration of water vapour in the atmosphere. These are averages, as water is very mobile, and changes rapidly between surface water, groundwater, water vapour, and clouds. And what do the larger peaks on the blue dotted line mean? The first peak up, around 3.9 GA, is an illustration of large amounts of water vapour that can be released when the Earth was hit by heavy asteroids or comets. No doubt there were many such peaks between 4.5 and 3.9 GA, especially during the ‘late heavy bombardment’. Not only could they vaporise entire seas due to the heavy impact. The comets were themselves a source of additional incoming water. The two peaks pointing down then: These are again those extreme ice ages. Again, it is illustrative rather than an accurate representation. It means that water vapour temporarily reduced sharply in the atmosphere due to global ice sheet cover. Indeed, these are periods when evaporation and precipitation start to largely stagnate.
CH4 – Methane
The pink line shows the trend of methane. This gas is a very strong greenhouse gas and is emitted by volcanoes on the one hand, and produced by some life forms on the other. Of course, a lot of methane was emitted at the start of the Earth (the big outgassing), but in much smaller quantities than water andCO2. You can clearly see that on the graph ind e first billion years. But after that comes a striking increase. The Archaea and Bacteria that emit methane then peaked. They consume hydrogen gas (H2) andCO2 for their metabolism. We suspect that they were among the very first life forms. They could thrive in the ancient oceans without much problem, limited only by the amount of nutrients. That is why the methane peak on the graph is between 3 and 2.5 GA. But then the amount of oxygen started increasing (GOE), which had two consequences: on the one hand, the methane in the atmosphere was rapidly oxidised by the oxygen gas, and on the other hand, the oxygen-enriched shallow ocean became unlivable for the methanogens. For them, oxygen is toxic, even in small quantities. We therefore see the concentration of methane collapse during the GOE, only to never rise again afterwards. Methane-producing organisms still exist frequently in low-oxygen environments (swamps, guts, anoxic deep waters), but the oxygen-rich atmosphere ensures that the gas cannot stay in our atmosphere for long. In any case, the greater amount of methane did contribute to a warmer climate for 2.5 GA. And that was important to compensate for the weaker sun.
Oxygen (O2) in the atmosphere has already been discussed in detail in the previous section (1.12), so we will not repeat this here.
Decision
Today, the amount of greenhouse gas is much lower than on early Earth, but still enough to maintain an ideal global temperature of 15°C on average. If you were to remove all greenhouse gases at once, our planet would have an average temperature of -18°C today. What certainly helps is the thermostat effect of the long-term carbon cycle (volcanism and silocate weathering). In other words, increased solar energy causes carbon to disappear faster into the mantle, as explained in 1.7.
In turn, the presence of photosynthetic life provides oxygen, which in turn has a regulatory effect, as well as making an ozone layer possible. The latter made land ecosystems possible on our living planet, once there was multicellular complex life. Oxygen helps regulate the climate, because it oxidises methane, for instance. Without oxygen, methane would increase too much in the atmosphere, and an exaggerated greenhouse effect would result. Moreover, oxygen helps accelerate rock weathering, a cooling effect via the carbon cycle.
In short, our planet has impressive adaptability thanks to a finely tuned atmosphere with numerous feedback mechanisms. For 4 billion years, it provided just enough of a stable environment to give complex life forms and rich biodiversity time to develop.